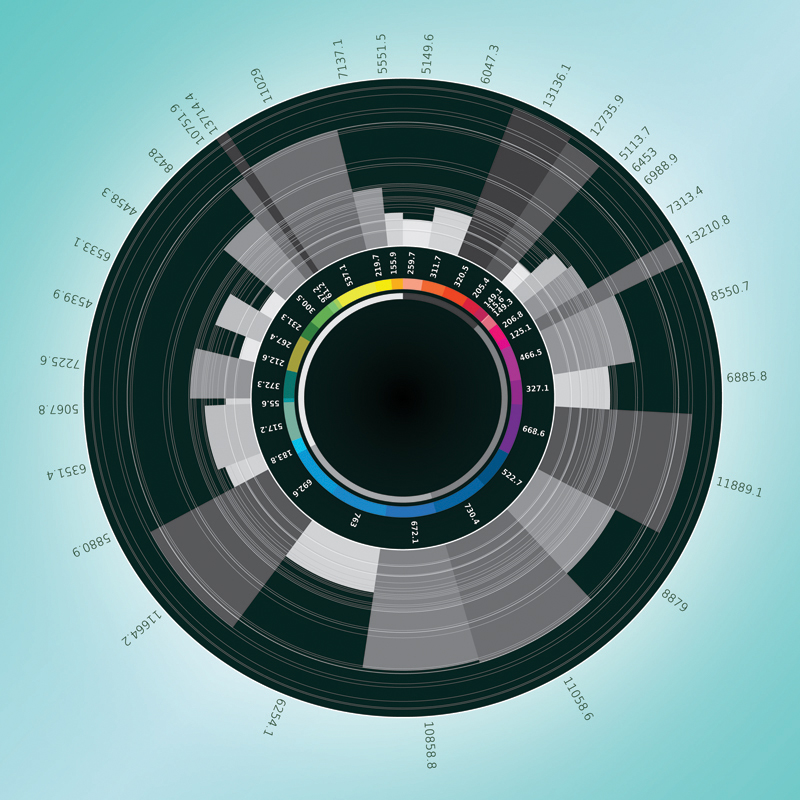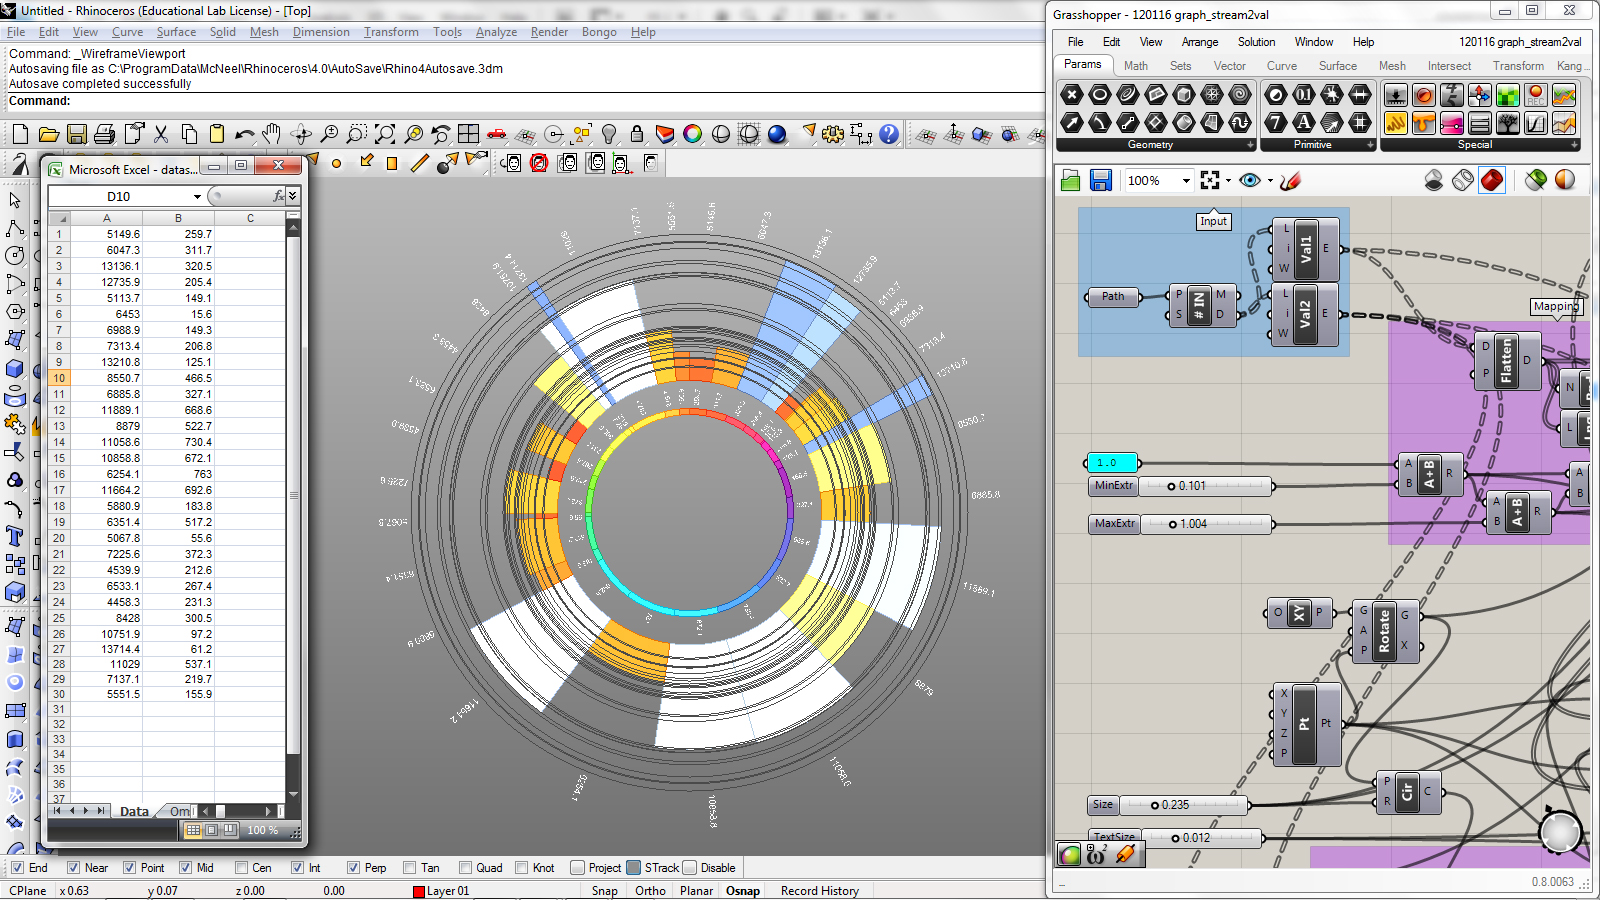
Grasshopper tooling experiment for data visualization. The script streams two sets of values (or more if desired) from an Excel spreadsheet via gHowl and maps data normalized on a two-dimensional piechart. First column values are distributed normalized along the inner chart to show ratios of the set. Additionally, the outer extrusion maps the second column normalized to a malleable minimum and maximum offset. Grab the GH definition and Excel sample file here and feel free to give me feedback in comments.